Are you considering alternatives to UT Bot Alerts for your trading signals? In this comprehensive guide, we’ll examine how combining the Crude Scalp Indicator with our custom 3-in-1 TP RSI tool can enhance your approach to reversal and pullback trading. These techniques are designed to help both day traders and swing traders improve their entry points in high-volume markets.
The Power of Crude Oil Scalping Indicator: Optimal Settings for Succes
The Intraday Crude Scalp Indicator is our primary source for buy and sell signals. Don’t be intimidated by its name – the indicator’s creator suggests it can be applied to any high-volume instrument. While it’s supposedly optimized for 3-minute charts, our testing revealed consistent performance across various timeframes, from 5-minute to 4-hour charts.
The indicator’s official guidelines recommend entering long positions when the candle breaks above the alert candle’s high, and short positions when it breaks below. However, we’ll adopt a modified approach, incorporating additional confluences from a secondary indicator.
Let’s fine-tune the settings for optimal performance.
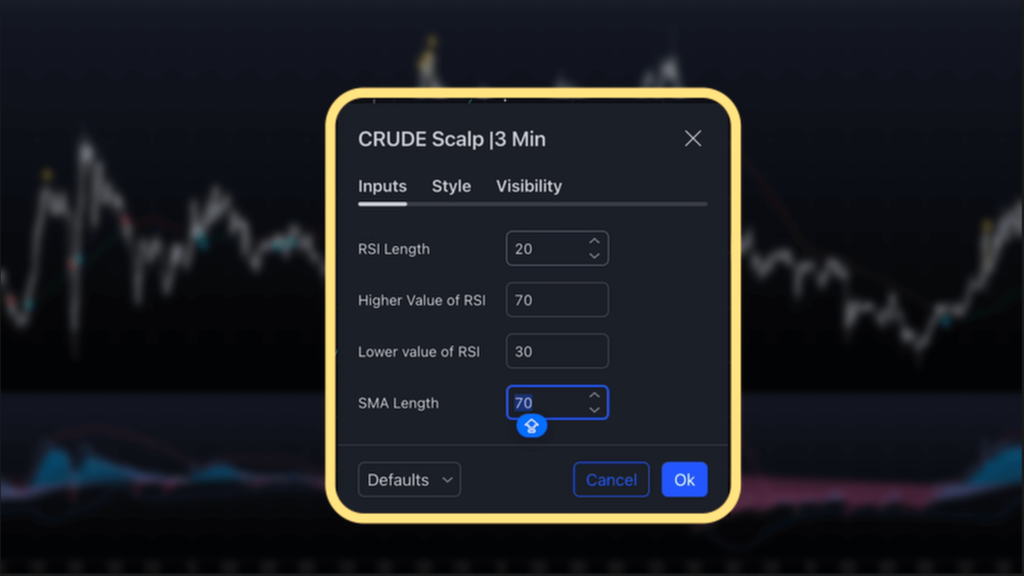
Unleashing the 3-in-1 TP RSI Indicator: Your All-in-One Trading Companion
To strengthen our trading decisions, we’ll incorporate the 3-in-1 TP RSI Indicator. This powerful tool combines three essential elements:
- Trend direction ribbon
- Bollinger Bands for volatility measurement
- RSI as a momentum indicator
By using this comprehensive indicator, we add multiple layers of confirmation to our trading strategy, reducing the risk of false signals.
If you’ve been a viewer of our channel for a while, you know that I never rely on just a single moving average in my strategies. Instead, I prefer using a ribbon while adding extra confluences to strengthen the setup. Our 3-in-1 TP RSI Indicator is designed with this approach in mind. It combines a trend direction ribbon, Bollinger Bands to measure volatility, and RSI as a momentum indicator—all in one tool. Let’s add it to our chart!
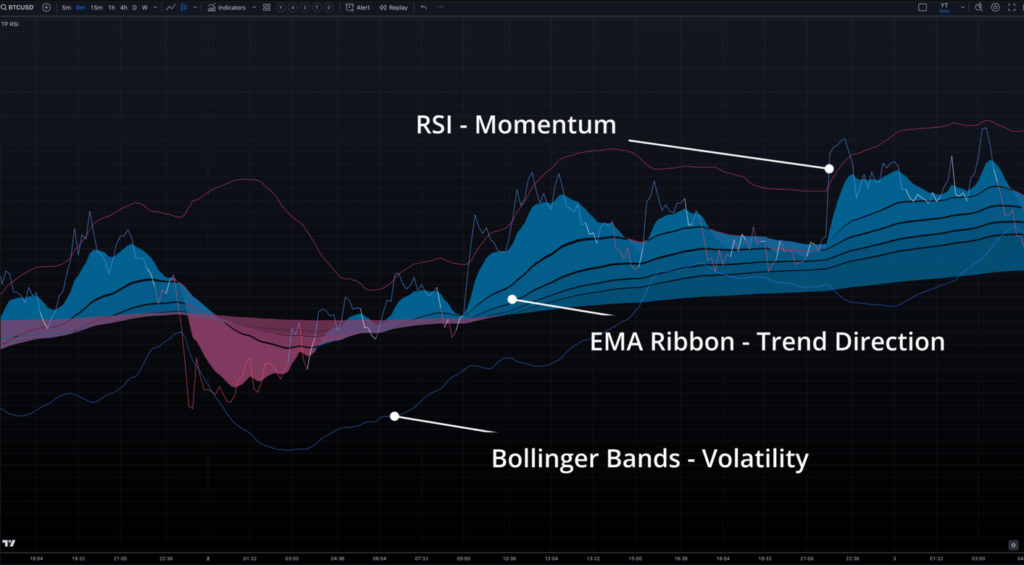
You can adjust the sensitivity of the TP RSI depending on your setup, but for intraday trading, I recommend leaving it at the default settings.
We have an in-depth video on our channel that explains how to use the TP RSI Indicator effectively. For today’s strategy, we’ll apply most of the rules discussed in that video to ensure we capture the most reliable entries, avoiding reliance on a single buy or sell signal.
Perfecting Your Entry Strategy: Combining TP RSI and Crude Scalp for Reversals
Take a look at these yellow signals given by the Crude Scalp indicator. They suggest that the price is either overbought or oversold, as in this case. However, it’s important to understand that this doesn’t mean you should immediately enter a trade against the prevailing trend. When the price hits these overbought or oversold regions, it often signals that the momentum is getting stronger. In some cases, the price might continue in the same direction for a while.
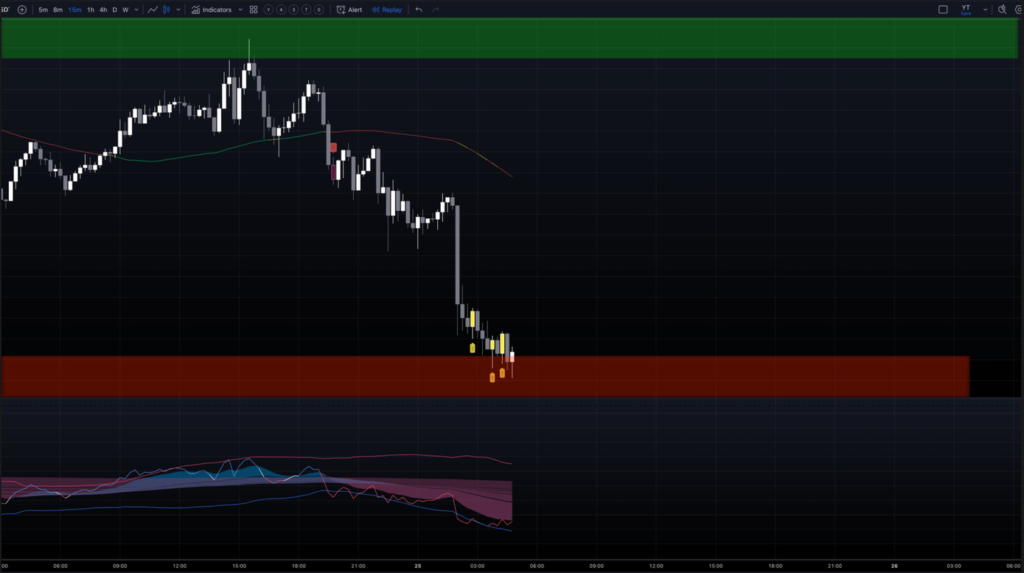
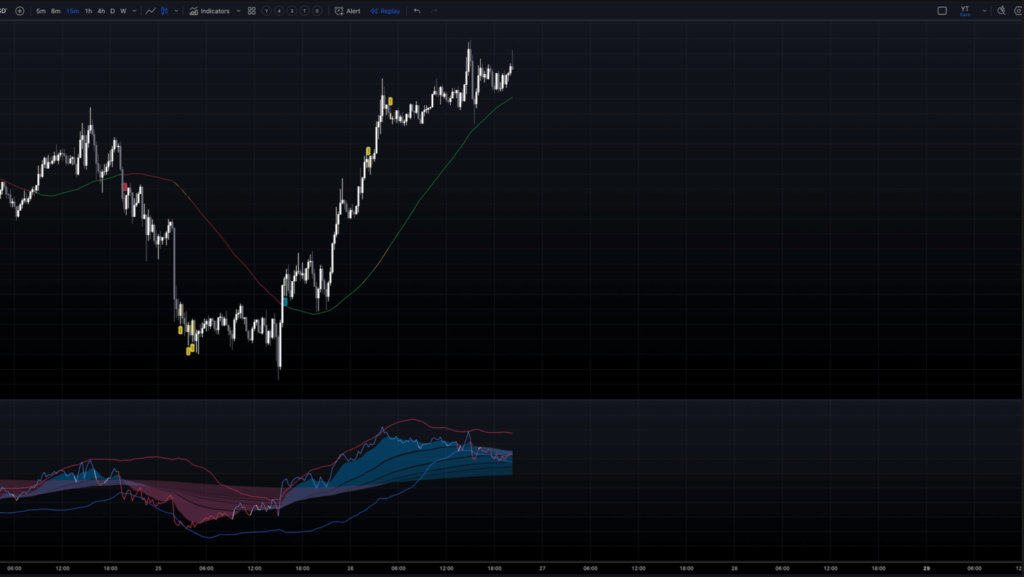
In this specific example, though, we see a textbook reversal pattern. The price is in a downtrend, hits an oversold level, and after ranging for a bit, it shoots up, eventually crossing the top Bollinger Band on the TP RSI. What strengthens this setup even more is the presence of bullish divergence on the RSI. While the price was making lower lows, the RSI was forming higher lows, indicating a potential reversal. This divergence is a powerful confirmation that the downtrend is losing steam and a reversal is likely.
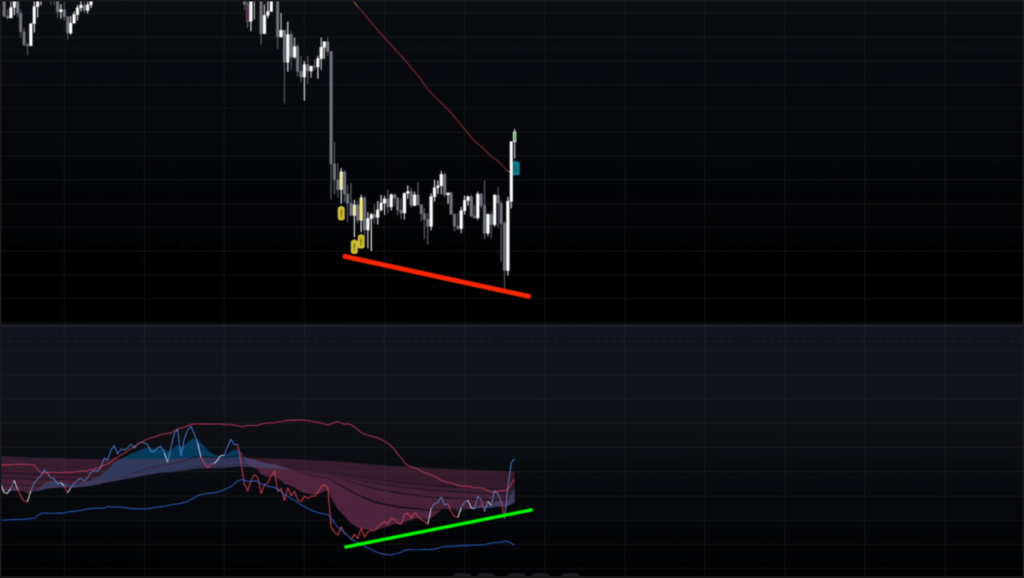
At this point, the Crude Scalp gives a buy signal, but we don’t enter just yet—we wait for a retest.
The retest occurs here, forming a perfect double bottom on the price chart, which is also confirmed by the TP RSI. The price is also get’s nicely rejected by this SMA here. Notice that all the bands of the ribbon have turned blue, signaling a strong trend, and the RSI has also formed a double bottom.
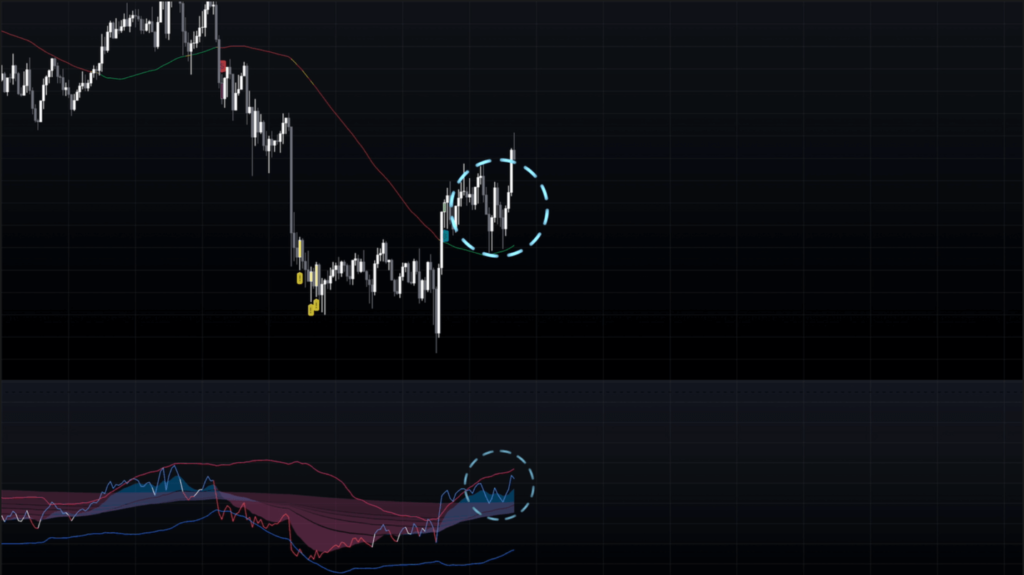
For a more aggressive approach, you can enter when the RSI gets first rejected by the ribbon while both coloured in blue or wait for a second re-test and the formation of the double bottom. Personally, I prefer waiting for a trendline break, although in this instance, it wasn’t very clear. However, the double bottom and the bullish divergence together make a strong case for entering the trade.
Mastering reversal trades requires a nuanced understanding of market dynamics. Here’s how to use our indicator combination effectively:
- Identify overbought/oversold conditions using Crude Scalp signals
- Confirm potential reversals with TP RSI Bollinger Band crossovers
- Look for bullish/bearish divergence on the RSI for additional confirmation
- Wait for a retest of key levels before entering the trade
- Consider using trendline breaks for more conservative entries
Trend Continuation: Mastering Pullback Trading
It’s clear that reversals like this don’t happen often, and while we’ve just reviewed a reversal strategy, this is still a break-and-retest setup. That means it can also be effectively used for trading trend continuation. Let’s go through a specific example for a short entry, so you can see how it works in both directions.
The same conditions apply to pullback trading for trend continuation, with one key difference: instead of looking for a reversal, you’re working with an already established trend, where the price is making lower lows, as in this case.
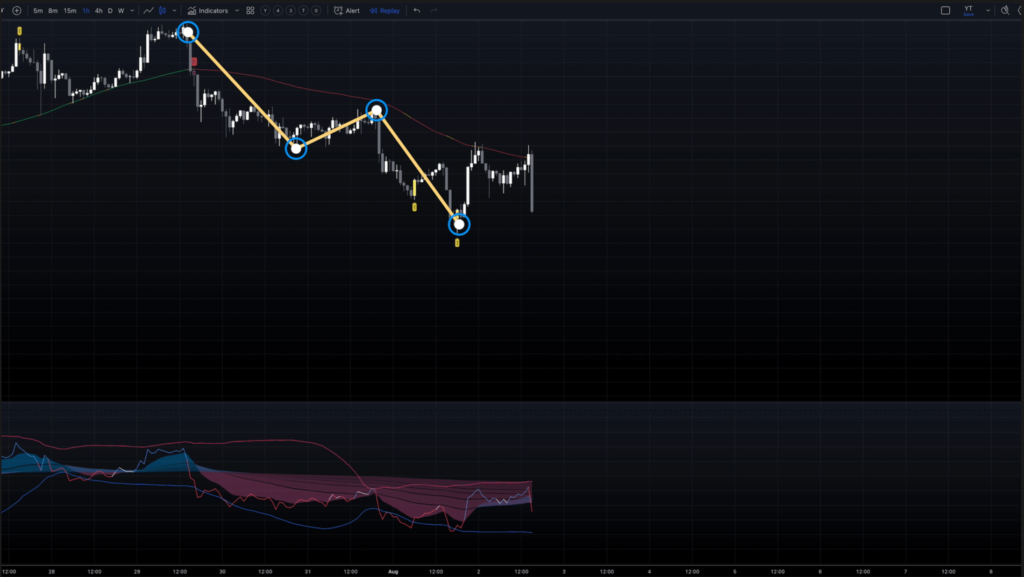
First, we need momentum confirmation. This happens when the RSI breaks the Bollinger Band in the direction of the trend, which in this case is downwards. We then look for a price pullback. During this pullback, we connect the recent swings on the RSI to form a trendline and wait for it to break.
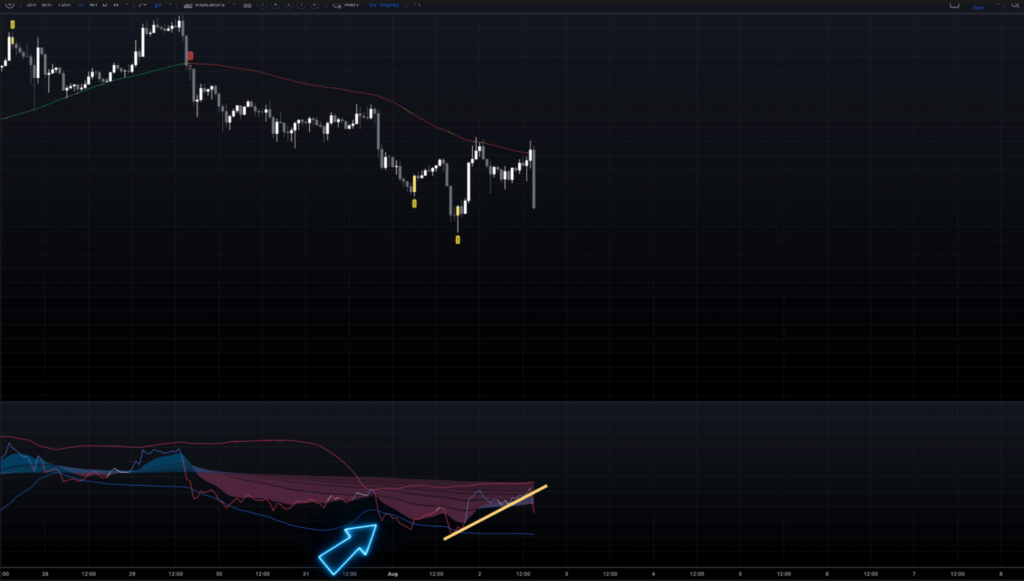
To strengthen this setup, watch for any hidden bearish divergence on the RSI. If during the pullback the price is making lower highs while the RSI is making higher highs, it’s a sign that the trend may continue downwards. This divergence adds extra confirmation to our setup.
Once the RSI breaks the trendline and we still have a flashing sell signal from the Crude Scalp indicator, we’re ready to enter the trade.
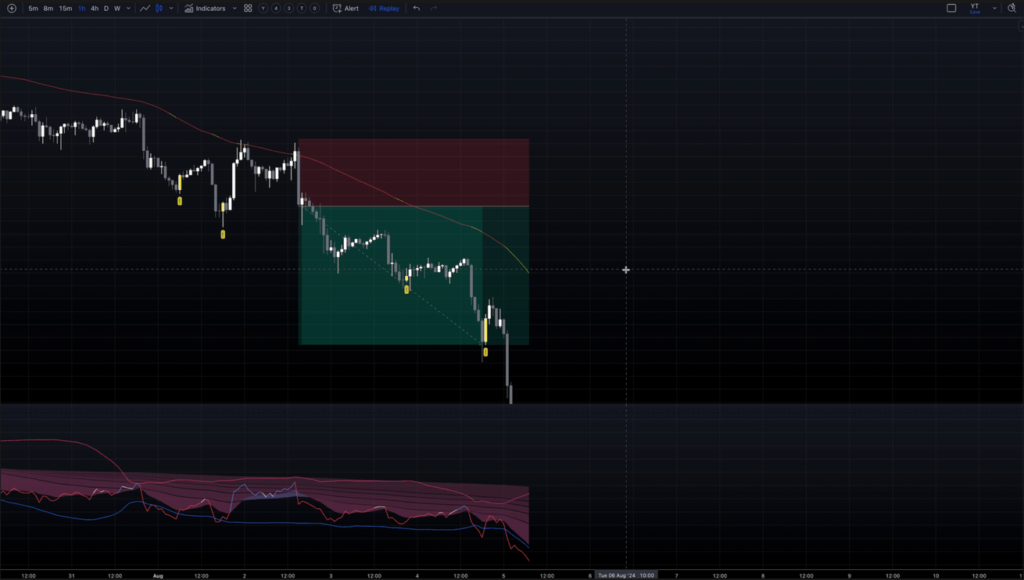
While reversals can be profitable, trend continuation trades often provide more frequent opportunities. Here’s how to apply our strategy to pullback trading:
- Identify an established trend (e.g., lower lows for downtrends)
- Wait for momentum confirmation with RSI breaking the Bollinger Band in the trend direction
- Look for a price pullback and draw a trendline on the RSI
- Watch for hidden divergence during the pullback for extra confirmation
- Enter the trade when the RSI breaks the trendline and Crude Scalp signals align
Crude Scalp vs. UT Bot Alerts: A Comparative Analysis
Speaking about which indicator gives better entries, please hear me out and read this part until the very end. I’ll explain everything you want to know, and I think you’ll be happy to hear my answer to the main question: which one is better—Crude Scalp or UT Bot?
Here’s the thing: both indicators are good, no doubt about it. They’re quite different, though. One is based on the ATR and its period, while the other gives signals from RSI and SMA sources. To give you my honest answer, I used the settings from the actual strategies I tested for both, as those settings worked best in my opinion.
To remove any subjectivity, I compared the entries given over the same period of time in a pullback strategy with TP RSI. Honestly, I didn’t notice any significant difference. Sometimes one indicator missed a signal at the right time, but they were mostly secondary confirmations. The main entry conditions—like trend direction, area of value rejection, and trendline breaks—were much more crucial in this case.
However, if we were to rely solely on the signals given by these two indicators, I’d probably give the edge to the UT Bot Alerts indicator. In my subjective opinion, its signals tend to appear much closer to the extremes, such as the tops and bottoms of price swings, compared to Crude Scalp. Crude Scalp’s signals, on the other hand, are typically generated closer to the area of value, often near the moving average.
This means UT Bot Alerts might catch more precise entries at potential reversal points, while Crude Scalp is better suited for identifying entries around key support or resistance levels within a trend.
Both indicators have their strengths, but how do they stack up against each other?
Crude Scalp:
- Generates signals closer to key support/resistance levels
- Better suited for entries within established trends
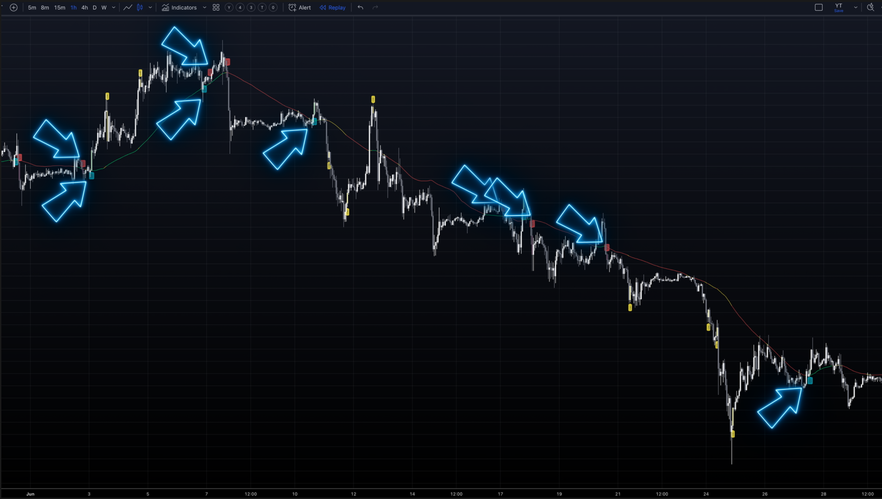
UT Bot Alerts:
- Provides signals closer to price swing extremes
- More effective for catching precise entries at potential reversal points
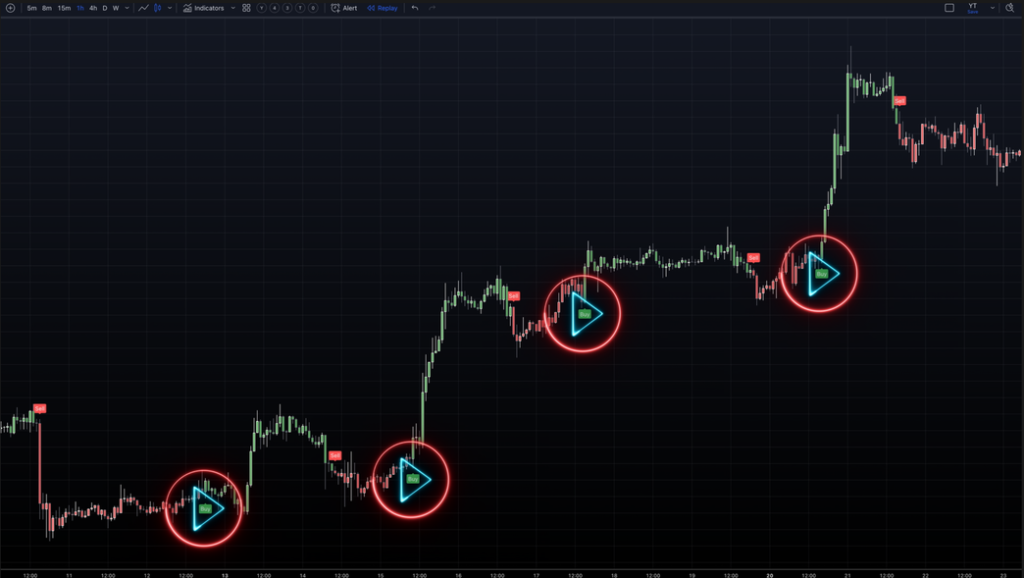
While both tools are valuable, the choice depends on your trading style and preferred market conditions.
Elevate Your Trading Game
By combining the Crude Scalp Indicator with the 3-in-1 TP RSI tool, you can potentially improve your performance in both reversal and pullback trading. It’s important to remember that no single indicator is perfect – the strength lies in combining multiple confluences to create a robust trading strategy.
To further develop your trading skills, consider exploring our breakout indicators strategy. With consistent practice and patience, you can work towards becoming a more informed and confident trader.
For more information about our breakout indicators strategy, we offer a detailed video walkthrough with step-by-step instructions and practical examples.

