In the ever-evolving world of trading, having the right tools at your disposal can make all the difference. After reviewing hundreds of indicators, we’ve narrowed down the top five TradingView indicators that every trader should consider adding to their arsenal in 2024. These powerful tools can help you refine your strategy, improve your decision-making, and potentially boost your trading performance.
1. Best Trend Filter: SwingArm ATR Trend Indicator
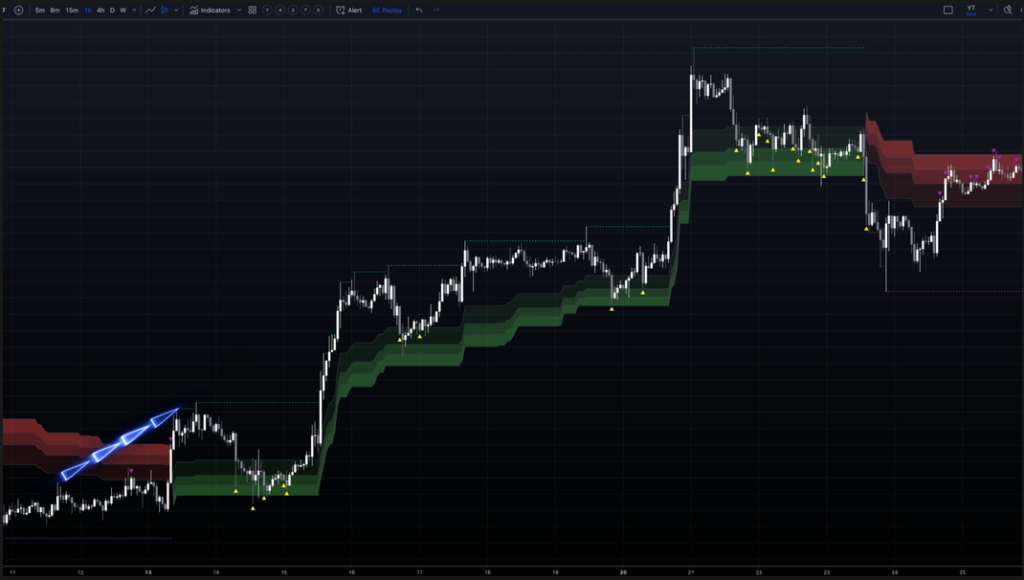
The SwingArm ATR Trend (also known as Blackflag FTS) is a sophisticated trend-following system that combines the robustness of Average True Range (ATR) with the precision of trailing stops. Here’s what makes it stand out:
- Adapts to market volatility for dynamic support and resistance levels
- Uses a modified true range calculation for accurate volatility measurement
- Creates a trailing stop that acts as rising support in uptrends and descending resistance in downtrends
- Incorporates Fibonacci levels (61.8%, 78.6%, and 88.6%) for potential entry points
- Adjustable ATR period and factor for fine-tuning sensitivity
How to use it: When the price crosses above the trailing stop, it signals a potential uptrend. Watch for pullbacks to the Fibonacci levels for entries, and use the trailing stop as a clear exit point if the trend reverses.
Learn more about the SwingArm ATR Trend Indicator
2. Best Buy and Sell Indicator: UT Bot Alerts
The UT Bot Alerts indicator is designed to provide clear, actionable signals in any market condition. Its key features include:
- Trailing stop mechanism that adapts to market volatility using ATR
- Color-coded chart bars (green for bullish, red for bearish)
- Clear “Buy” and “Sell” labels plotted directly on the chart
- Customizable sensitivity with adjustable “Key Value”
- Option to use Heikin Ashi candles for smoother signals
- Adjustable ATR period for responsiveness to recent volatility
How to use it: Look for a green bar after a series of red bars, accompanied by a “Buy” label, as a signal to consider a long position. Conversely, a red bar after green bars with a “Sell” label suggests exiting longs or considering a short position.

Explore the UT Bot Alerts Indicator
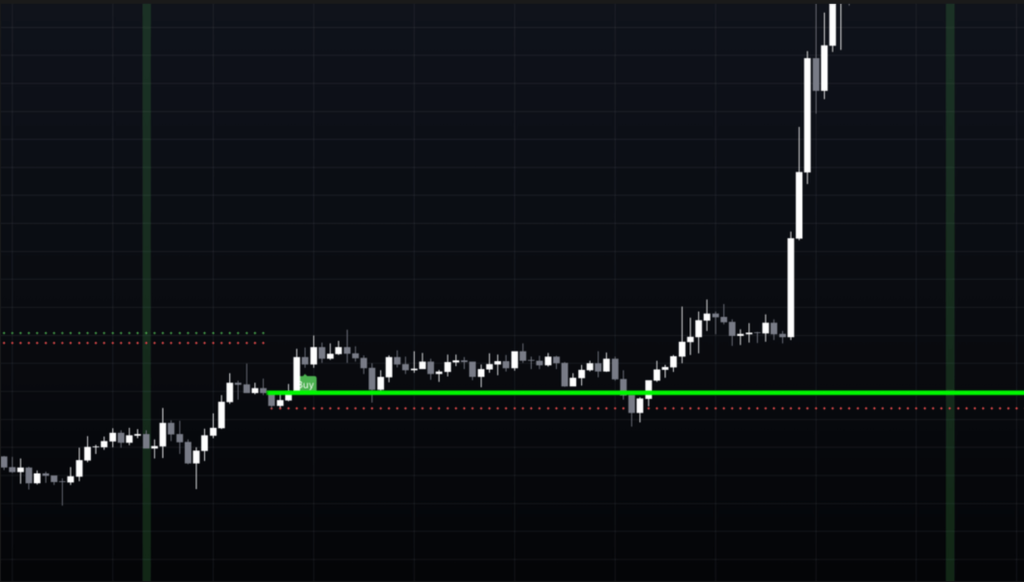
3. Best for Day Trading: ORB Breakout Indicator
The ORB Breakout (or “High and Low”) indicator is particularly well-suited for intraday trading. Its unique features include:
- Ability to set specific time points for marking high and low levels
- Compatibility with different market sessions and time zones
- Visual cues with green and red crosses marking high and low levels
- Signal generation based on price action and momentum
How to use it: Set the time to mark levels just after the market open, then wait for price action to develop. A break above the marked high with increasing momentum (shown by higher highs) signals a long opportunity, while a break below the low with decreasing prices suggests a short opportunity.
Check out the ORB Breakout Indicator
4. Best for Breakouts: Breakout Finder Indicator
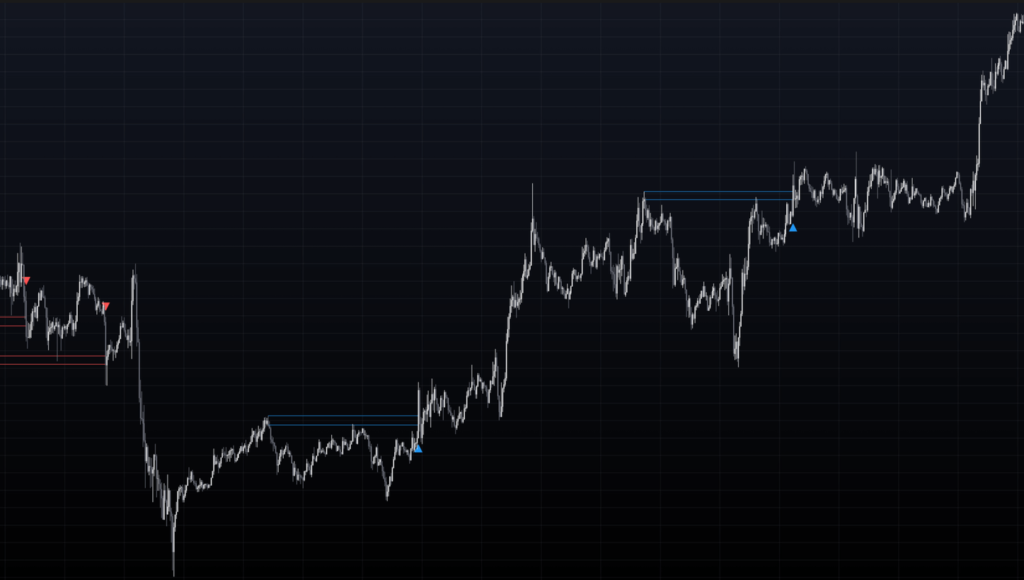
The Breakout Finder is an excellent tool for identifying and capitalizing on market breakouts. Key aspects include:
- Customizable lookback period for pivot point analysis
- Adjustable maximum breakout length
- Threshold rate to define significant breakout zones
- Minimum number of tests required for important levels
- Visual display of potential breakout zones (blue for bullish, red for bearish)
- Confirmation criteria for improved signal reliability
- Customizable alert settings
How to use it: Adjust parameters to align with your trading style. The indicator signals a potential breakout when price moves decisively through a marked zone. Use in conjunction with other forms of analysis for a more comprehensive approach.
Discover the Breakout Finder Indicator
5. Most Versatile Indicator: TP RSI
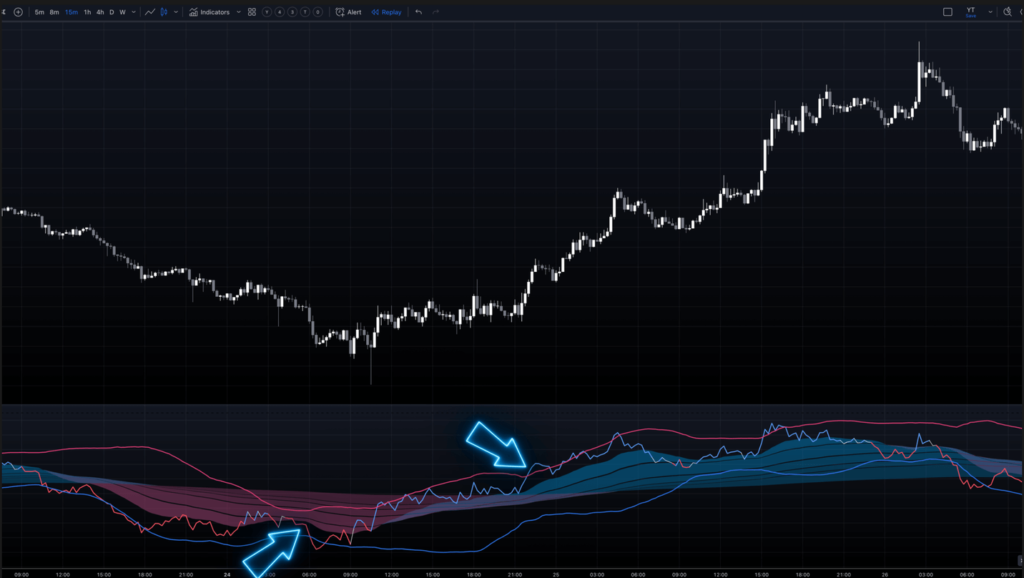
The TP RSI combines elements of the Relative Strength Index (RSI), multiple moving averages, and Bollinger Bands for a comprehensive view of market conditions. Its features include:
- Customizable RSI with adjustable period and price source
- Bollinger Bands applied to the RSI for volatility insights
- Five pairs of moving average “clouds” for multi-timeframe trend tracking
- Color-coded feedback for easy interpretation
How to use it: Use the moving average clouds for trend identification (blue for uptrend, red for downtrend). Analyze momentum using the RSI line color (blue for strong upward, red for strong downward, white for neutral). Look for overbought or oversold conditions using the Bollinger Bands on the RSI, and watch for confluences or divergences for stronger trade signals.
Learn about the TP RSI Indicator
Conclusion
These five powerful TradingView indicators can significantly enhance your trading toolkit in 2024. Whether you’re a beginner or an experienced trader, incorporating these tools into your strategy can help you make more informed decisions and potentially improve your trading performance. Remember, while these indicators are powerful on their own, they work best when combined with other forms of analysis and integrated into a well-rounded trading plan.
Whether you’re a beginner or an experienced trader, I highly recommend watching our recent video, where we review a simple yet effective trading strategy that truly works.
Happy trading!

