Are you looking to enhance your trading analysis with more precise trend identification? The HAMA (Heikin-Ashi Moving Average) indicator might be exactly what you need. This comprehensive guide will walk you through everything you need to know about this powerful trading tool that combines Heikin Ashi candles with moving averages for clearer trend analysis.
Understanding the HAMA Indicator
HAMA Candles, short for Heikin-Ashi Moving Average Candles, represent an innovative approach to price action analysis. By merging the smoothing capabilities of moving averages with the visual clarity of candlestick charts, HAMA offers traders a unique perspective on market trends.
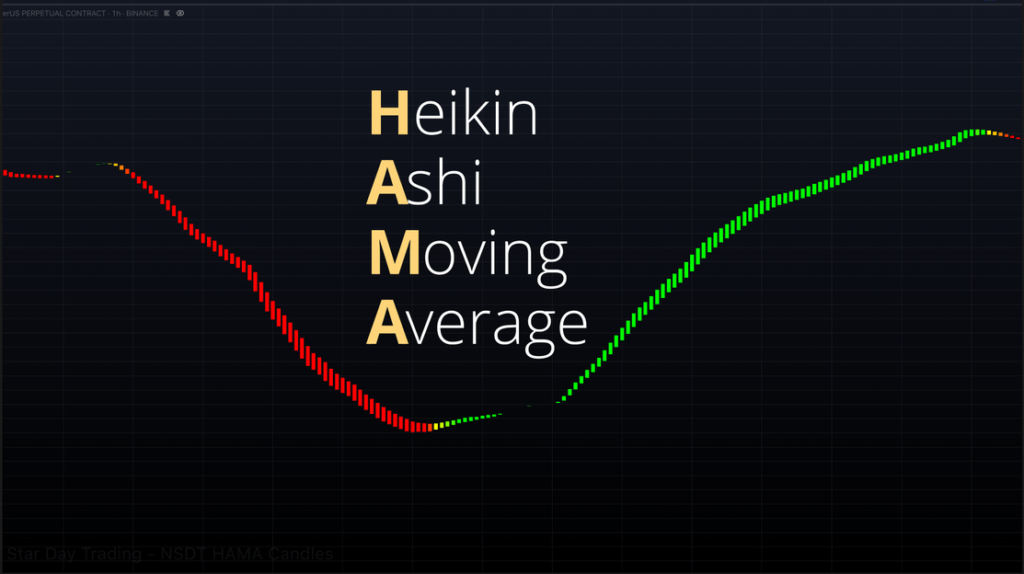
What sets HAMA apart is its ability to build upon the traditional Heikin Ashi concept through the integration of moving averages. This combination provides additional confirmation of trend strength and direction, potentially offering clearer signals compared to standard Heikin Ashi candles.
The Foundation: Heikin Ashi Explained
At its core, Heikin Ashi candles are a modified version of traditional candlestick charts. Their primary purpose is to filter out market noise and make trends more apparent to traders. Instead of using standard price points, Heikin Ashi employs average prices, resulting in a smoother visual representation of market movements.
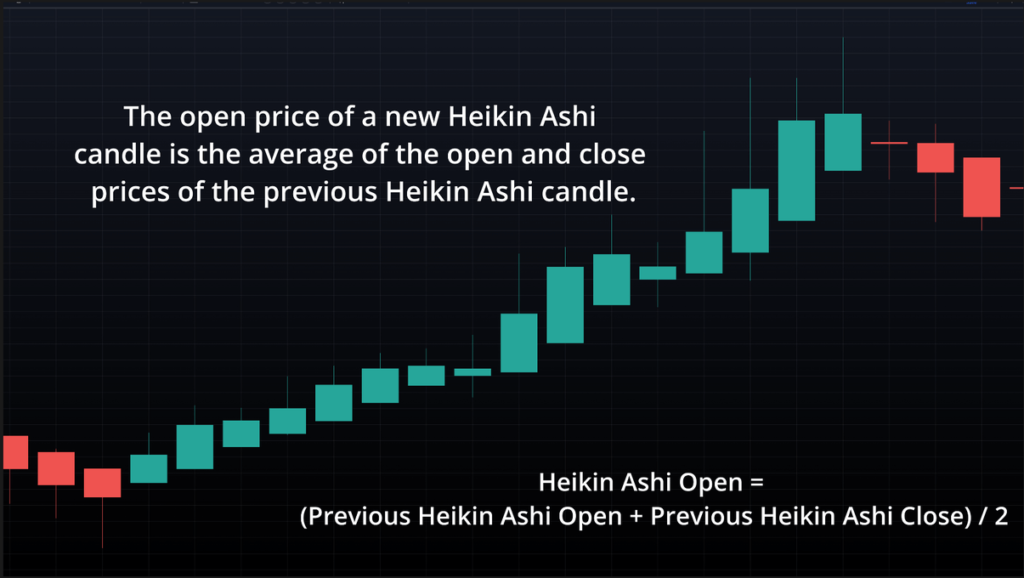
One of the key advantages of Heikin Ashi charts is their ability to display trend strength through candle patterns. For instance:
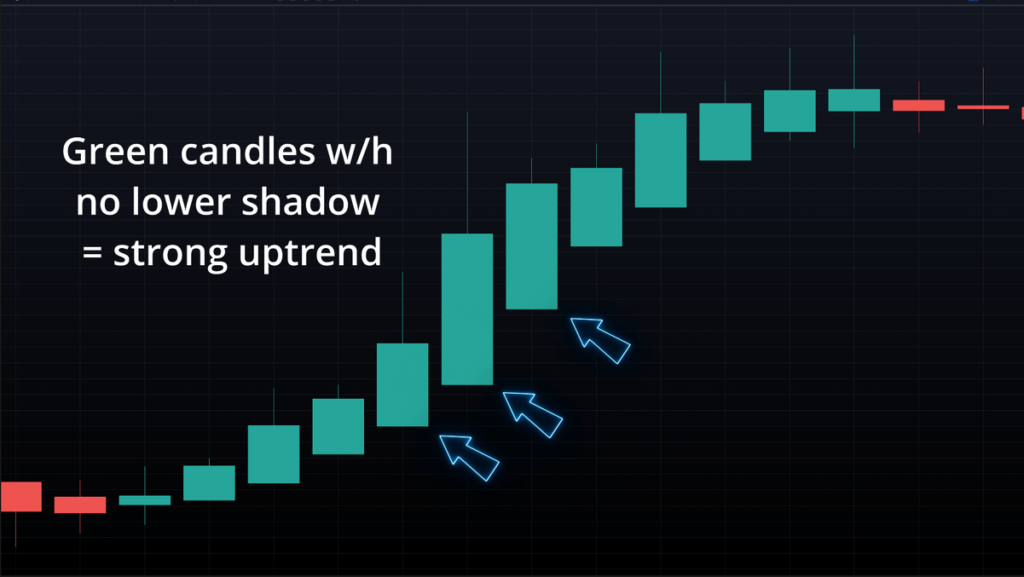
When you see green candles with no lower shadow, it’s a strong indication of an uptrend. Conversely, red candles with no upper shadow typically signal a strong downtrend.

The length of shadows (or wicks) in Heikin Ashi charts provides valuable insight into trend strength. Shorter shadows generally indicate stronger trends, while longer shadows might suggest increased volatility or potential trend weakness.
The NSDT HAMA Candles Indicator
The “NSDT HAMA Candles” by NorthStarDayTrading takes the Heikin Ashi concept to the next level. This versatile indicator allows traders to maintain their preferred chart type while overlaying the HAMA analysis. Available on TradingView, it offers extensive customization options to suit different trading styles.

Customization Options
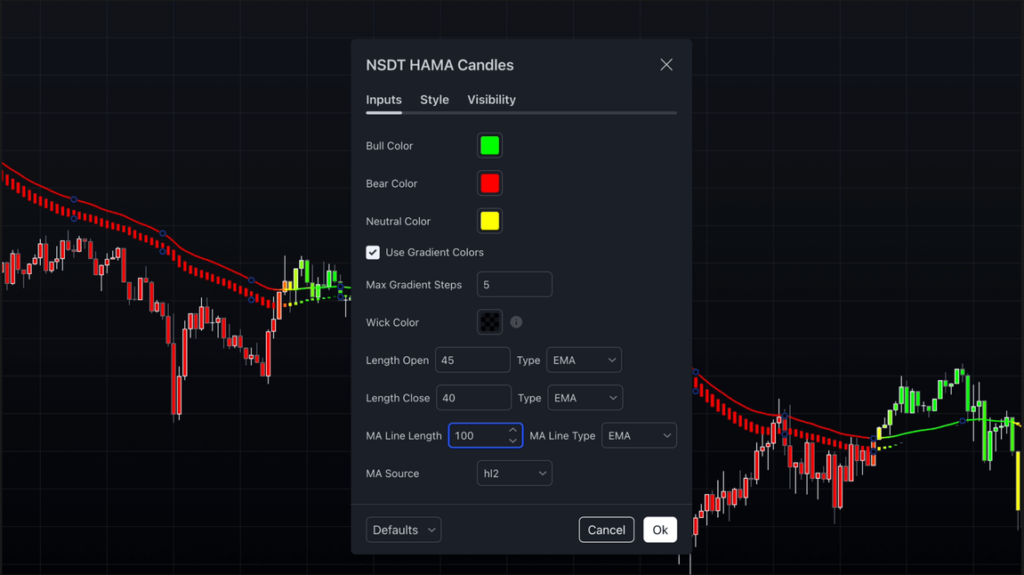
The indicator provides several adjustable parameters:
- Customizable lengths for both open and close calculations
- Optional wick visibility for a more traditional Heikin Ashi appearance
- Adjustable Moving Average settings, including length and type (EMA, SMA, or WMA)
Implementing an Effective HAMA Strategy
Here’s a practical approach to implementing the NSDT HAMA Candles indicator in your trading:
Recommended Settings
For optimal performance, consider starting with these settings:
- Open length: 45
- Close length: 40
- Moving Average: 100-period EMA
Entry Strategy
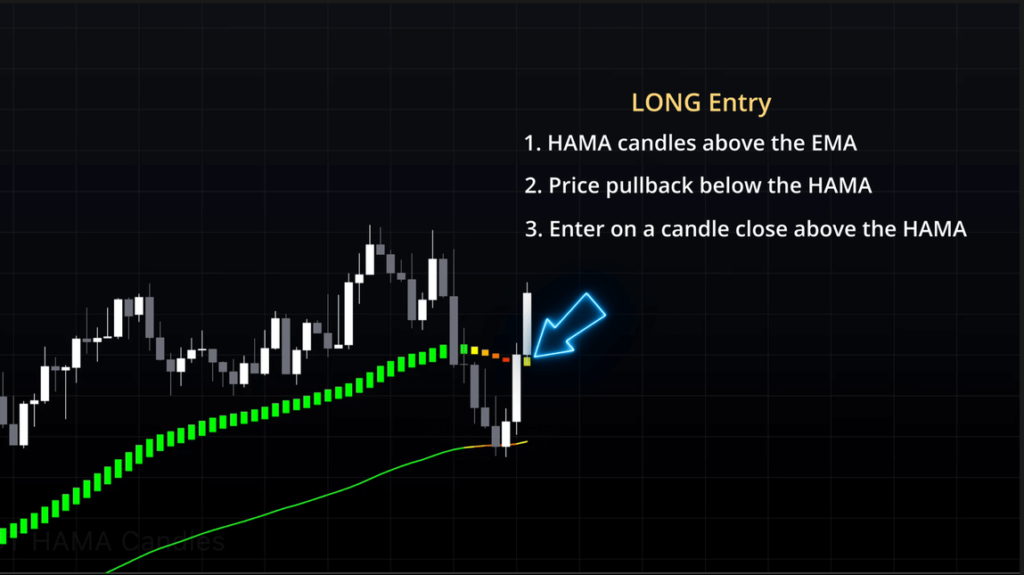
For long positions, follow these guidelines:
- Confirm that HAMA candles are positioned above the EMA
- Wait for a price pullback where the price intersects with HAMA candles
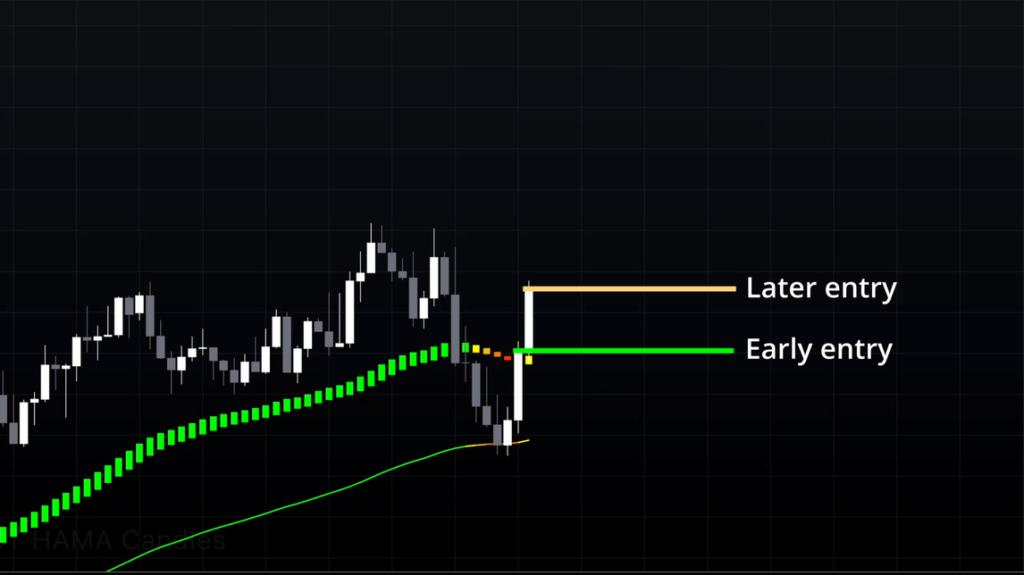
- Enter the trade when a candle closes above the HAMA
For a more conservative approach, wait for a HAMA candle to print below the price candle, though this may result in later entries.
Exit Strategy
Consider exiting your position when:
- A price candle closes below the HAMA
- Your predetermined risk-reward target is reached
- HAMA candles begin to decrease in size (consider scaling out)
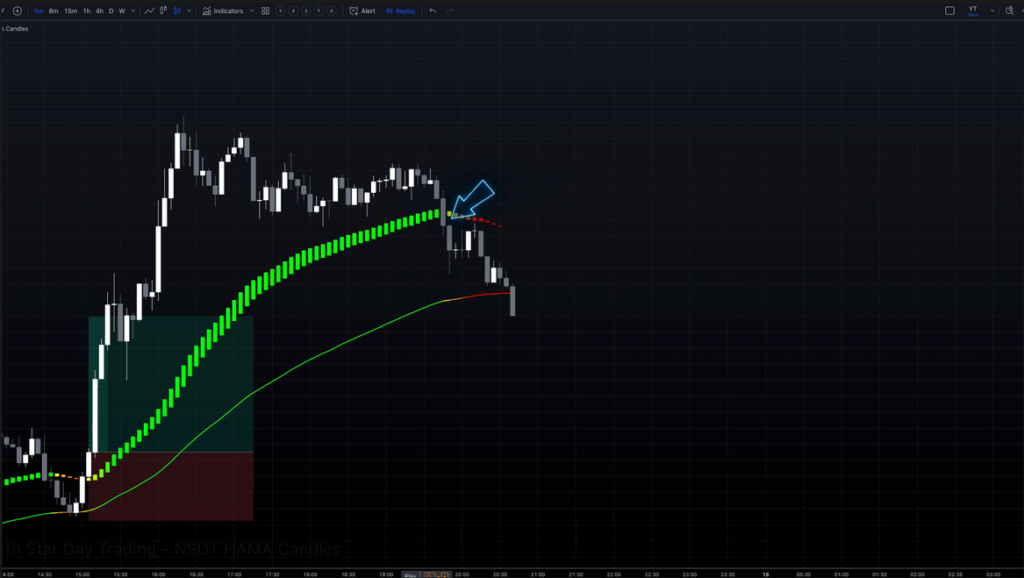
Remember, while these settings and strategies have proven effective, they should serve as a starting point. Feel free to adjust them based on your trading style, risk tolerance, and market conditions.
The HAMA indicator represents a sophisticated evolution in technical analysis, combining the best aspects of Heikin Ashi candles and moving averages. By understanding and properly implementing this tool, traders can potentially enhance their ability to identify and follow market trends with greater confidence.

