Trading successfully requires more than just intuition—it demands strategic tools and precise indicators. In this guide, we’ll explore a powerful combination of two TradingView indicators that can significantly enhance your trend trading strategy.
Understanding the NNFX Baseline Tool: A Versatile Indicator
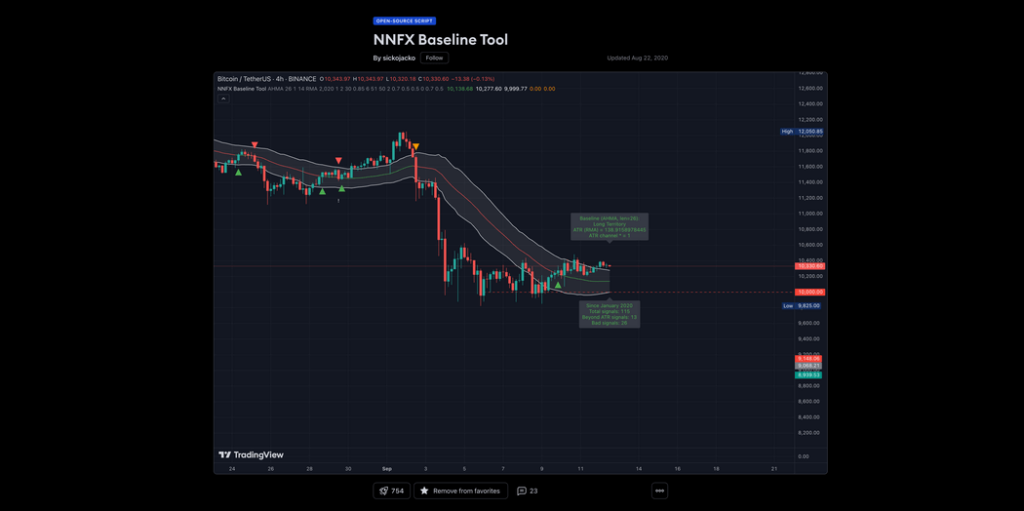
The NNFX Baseline Tool, created by sickojacko, is a game-changer for traders seeking flexibility and precision. This robust indicator brings an impressive array of 27 different moving average types, each fully customizable to match your unique trading preferences.
Baseline Options and Customization
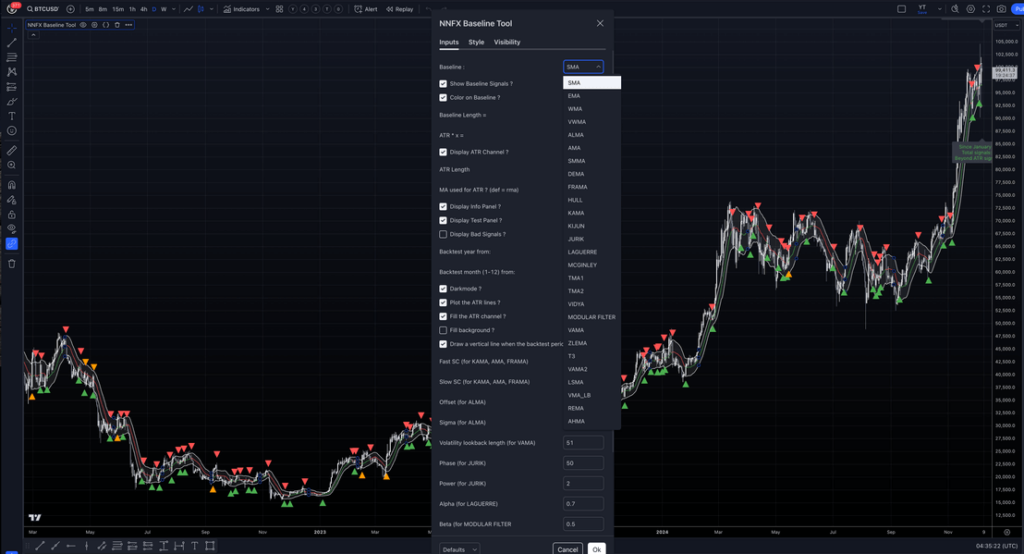
When setting up this tool, traders have an extraordinary range of moving average options. From classic choices like Simple Moving Average (SMA), Exponential Moving Average (EMA), and Weighted Moving Average (WMA) to more advanced selections such as ALMA, Jurik, and McGinley, the possibilities are expansive.
Key Features of the NNFX Baseline Tool
The tool’s standout feature is its integrated Average True Range (ATR) channel, which creates a dynamic zone around your chosen baseline. This zone helps traders identify potential entry and exit points with remarkable clarity. By adjusting the ATR factor, you can fine-tune the channel’s width according to your risk tolerance and current market conditions.
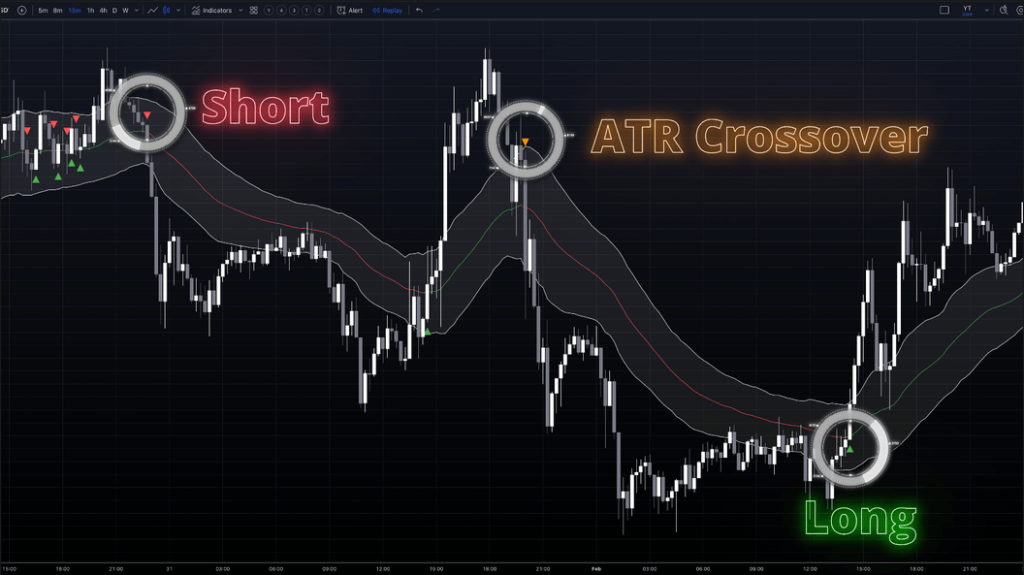
Visual traders will appreciate the indicator’s signaling system: green for long entries, red for short entries, and orange for crossovers beyond the ATR channel. These color-coded signals make spotting trading opportunities more intuitive.
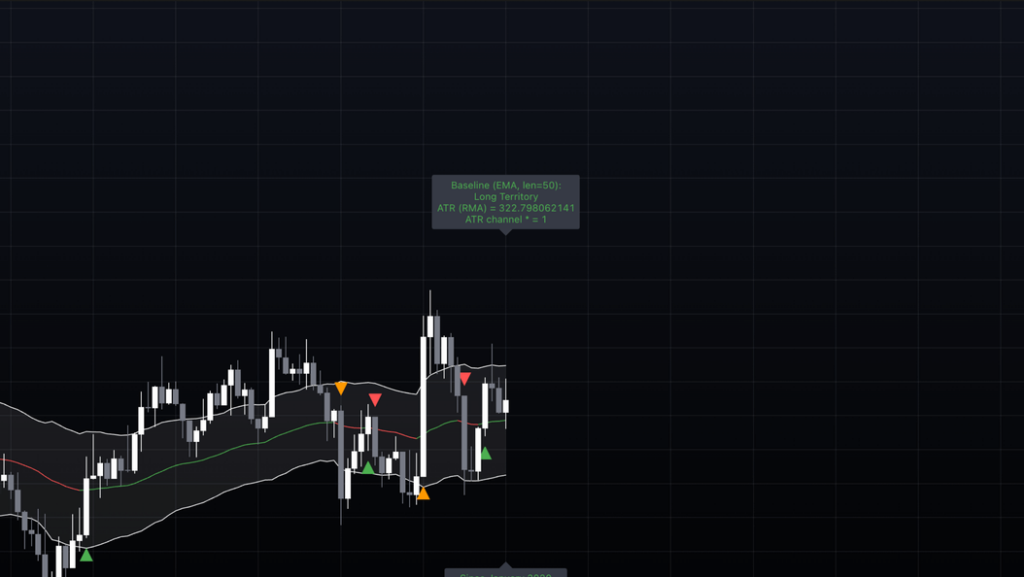
An additional highlight is the testing panel, which tracks the total number of signals and those generated beyond the ATR channel—a valuable feature for backtesting and strategy refinement.
Trend Strength Confirmation with ADX
To elevate your trading strategy, we’ll introduce the Average Directional Index (ADX), a technical indicator designed to measure trend strength irrespective of direction.

Understanding ADX Mechanics
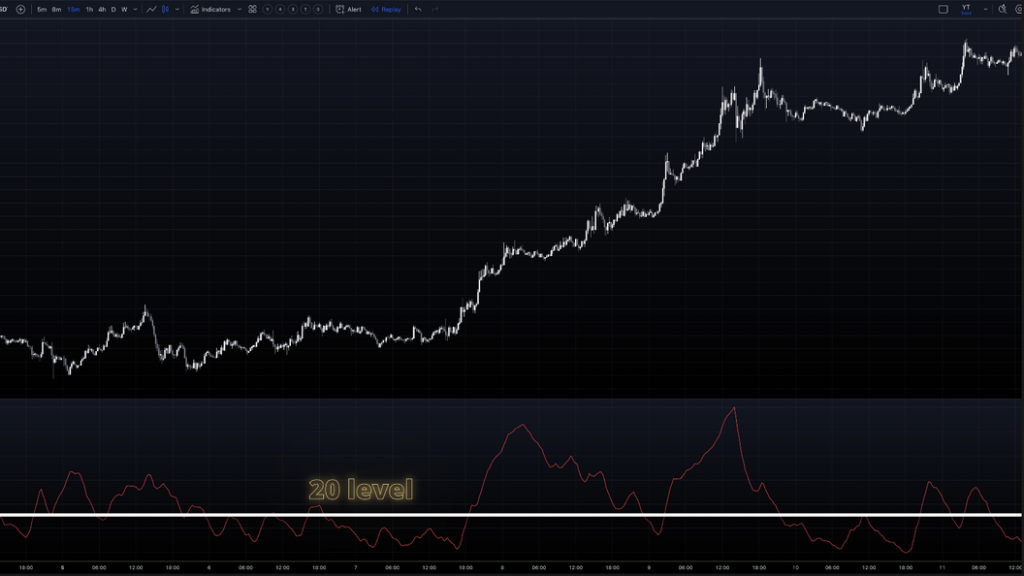
The ADX oscillates between 0 and 100, with higher readings signaling stronger trends. Traders typically use two key thresholds:
- Readings below 20 suggest a weak trend or ranging market
- Readings above 20 or 25 indicate a robust trend
For our strategy, we’ll use 20 as our trend strength benchmark.
Crafting a Winning Trading Strategy
Here’s how to combine the NNFX Baseline Tool and ADX for more reliable trading signals:
Configuration Details
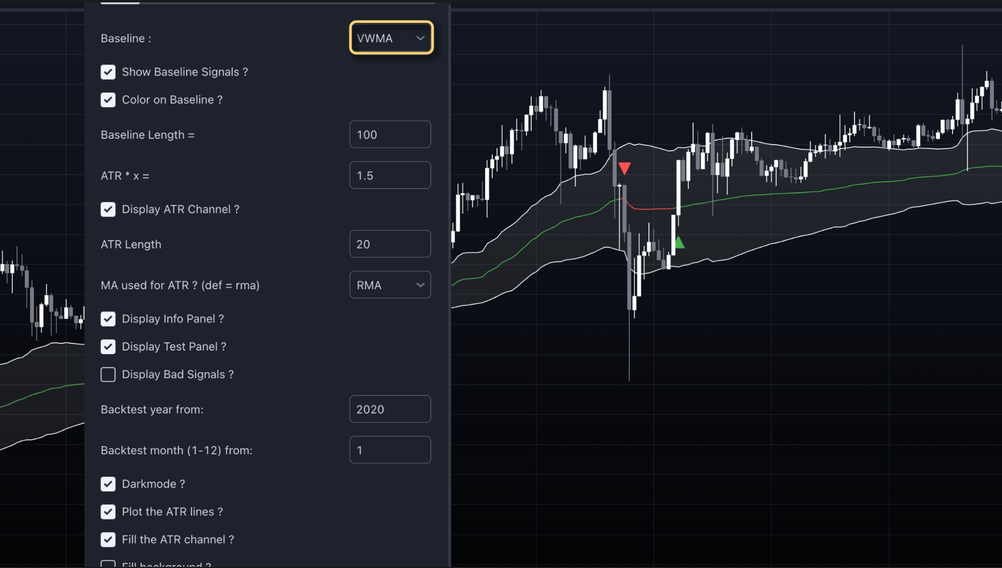
Start by configuring the NNFX Baseline Tool:
- Set period length to 100
- Use Volume Weighted Moving Average (VWMA) as the baseline
- Set ATR to 1.5 with a length of 20
Place a horizontal line on the ADX indicator at the 20 level, ensuring you only consider markets with strong trending characteristics.
Entry Strategy Breakdown
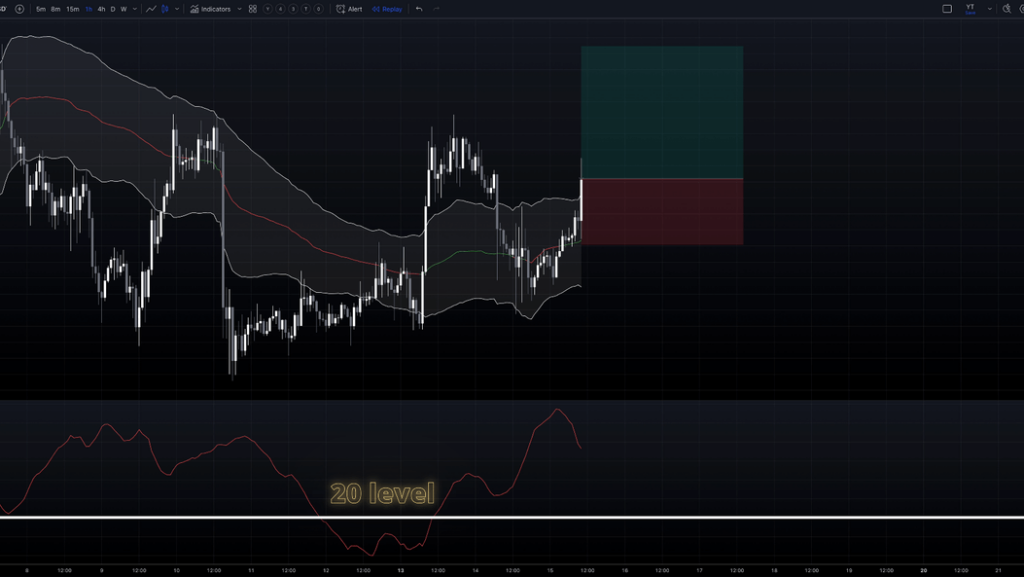
Long Position Entry:
- Price must be above the upper ATR band
- Look for a pullback
- Ensure price does not cross the bottom ATR band
- Enter on a candle close above the upper band
- Confirm ADX is above the 20 line
Short Position Entry:
- Price below the lower band
- Identify a pullback
- Close a candle below the lower band
- Confirm ADX is above the 20 line
Pro Tips
While we’ve demonstrated the strategy with VWMA, don’t hesitate to experiment with different moving average types. Each market and asset might respond uniquely to various moving average calculations.
Conclusion
By combining the NNFX Baseline Tool’s versatile moving average analysis with ADX’s trend strength confirmation, traders can develop a more robust and reliable trading approach. Remember, successful trading is about continuous learning, testing, and adapting your strategies.
For those eager to dive deeper into price action strategies, we recommend checking out our latest video resources.


