Trading success often hinges on finding the right tools that simplify complex market dynamics. Today, I’ll introduce you to a powerful yet remarkably simple indicator that can transform your trading approach.
Unveiling the Price Volume Trend (PVT) Indicator: A Game-Changer in Technical Analysis
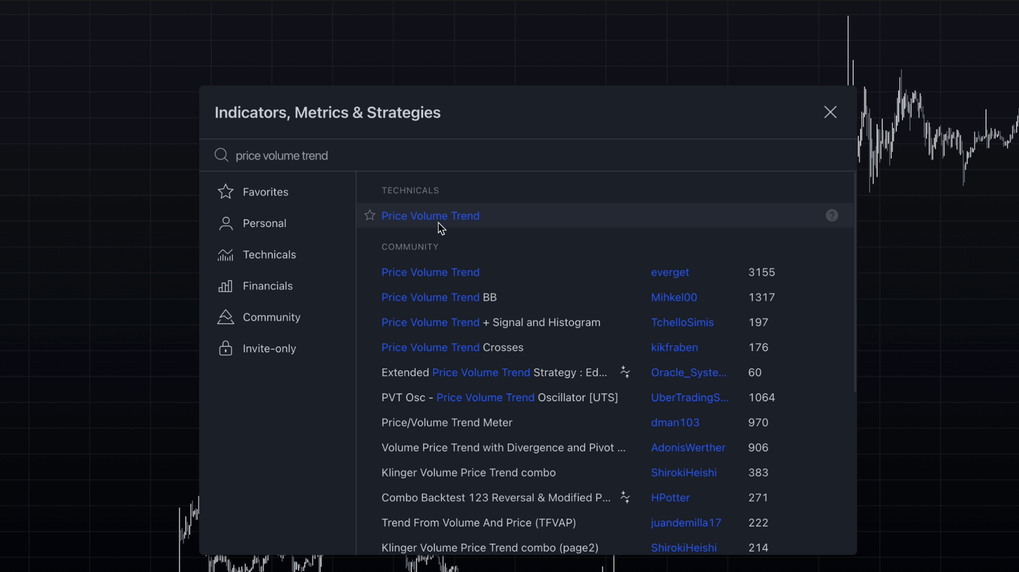
The Price Volume Trend (PVT) indicator represents a sophisticated evolution in volume-based technical analysis. While similar to the On Balance Volume (OBV) indicator, PVT offers a more nuanced approach to understanding market movements.
Why PVT Stands Out from Other Volume Indicators
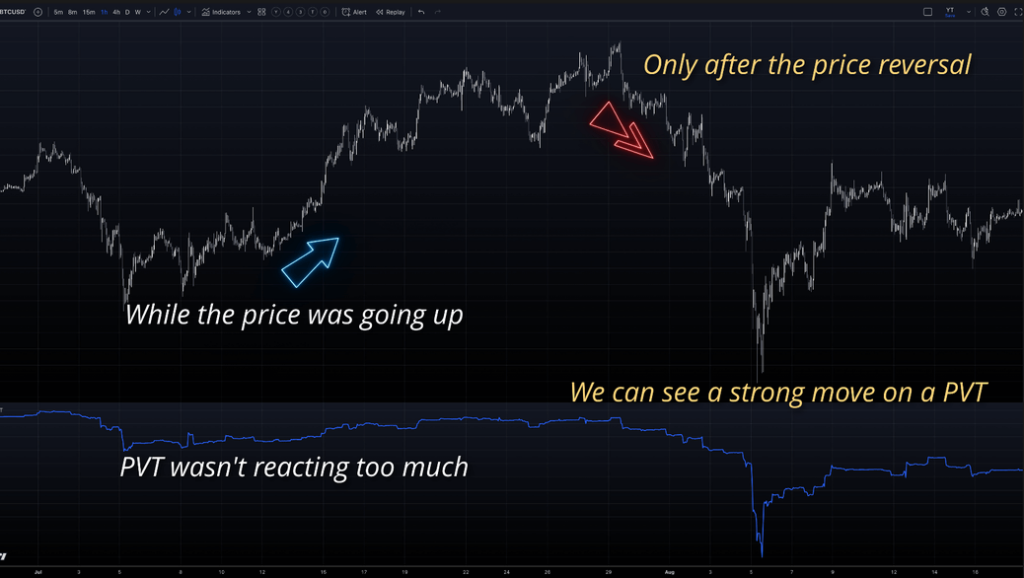
Unlike traditional volume indicators that simply accumulate total volume, PVT takes a more intelligent approach. It factors in the magnitude of price changes, providing traders with a more comprehensive view of market dynamics. This means PVT doesn’t just tell you how active the market is—it reveals how meaningful that activity truly is.
Traders find PVT particularly valuable for two critical purposes:
- Determining the genuine momentum behind a trend
- Identifying potential market turning points where price movement seems disconnected from underlying market pressure
Mastering Reversal Strategies with PVT
One of PVT’s most powerful features is its ability to highlight trading ranges and potential reversal points with remarkable clarity. Where price action might appear chaotic, the PVT often provides a more consistent narrative.
Spotting Bearish Divergences
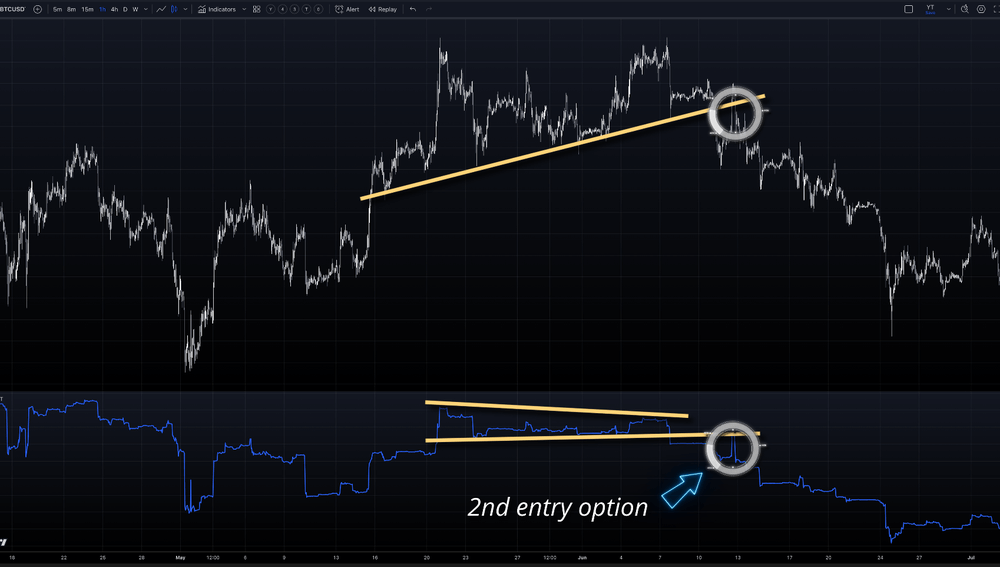
Consider a scenario where the price creates a higher high, but the PVT forms a lower high. This bearish divergence signals potential weakness in the current trend. Switching to a line chart can make these patterns even more apparent.
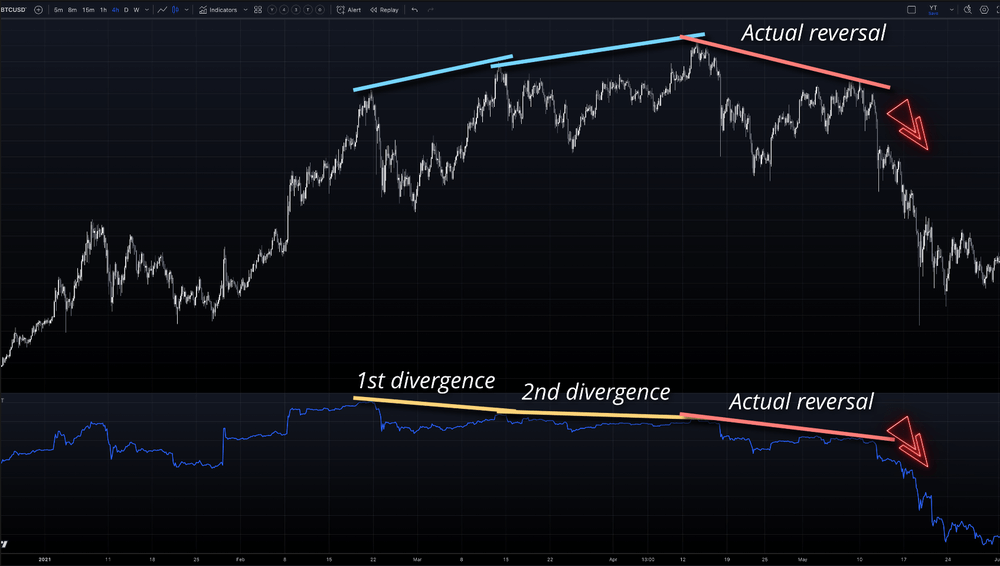
Traders can approach this in two ways:
- Aggressive Entry: Enter immediately when the PVT breaks a significant line
- Conservative Entry: Wait for a re-test and rejection of the broken line
Trend Following Techniques with PVT
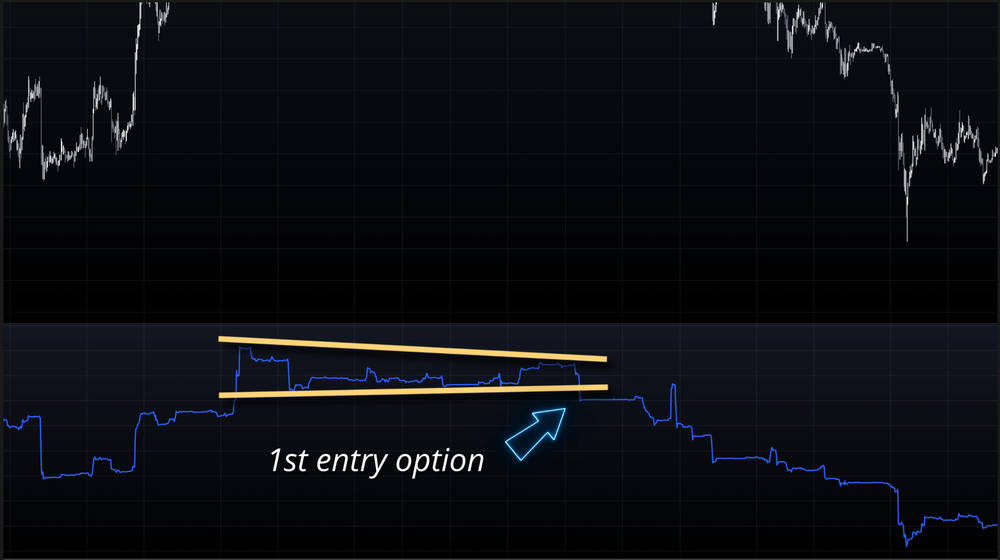
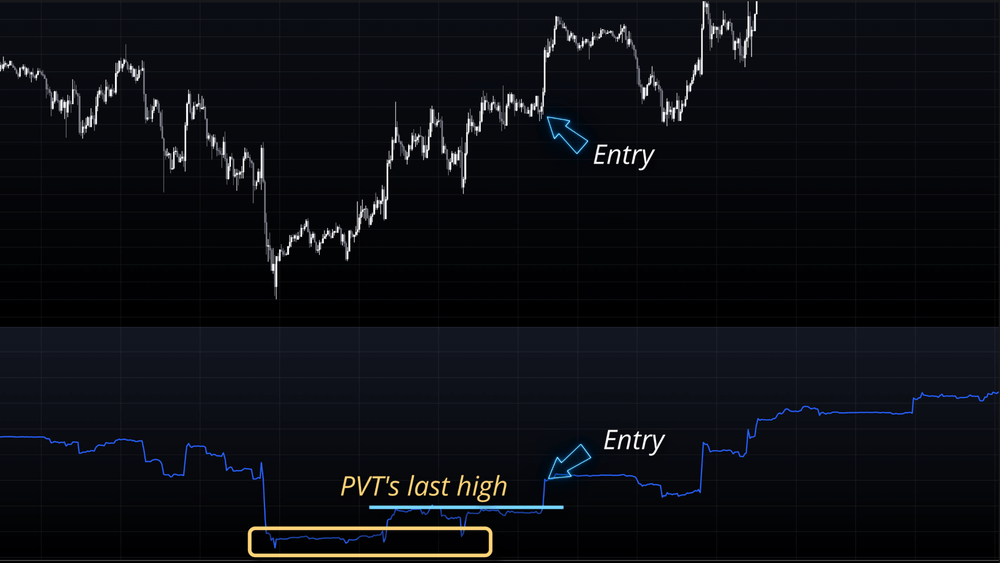
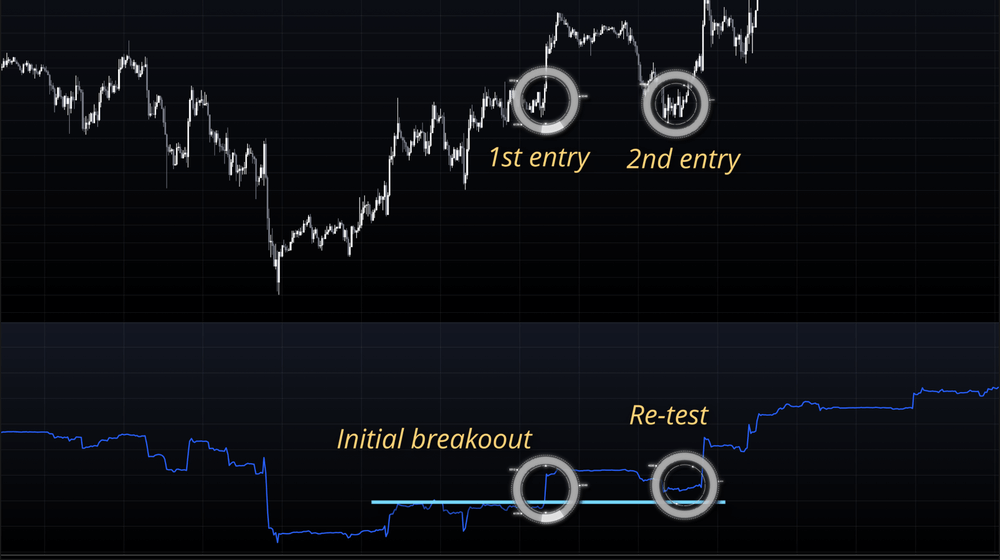
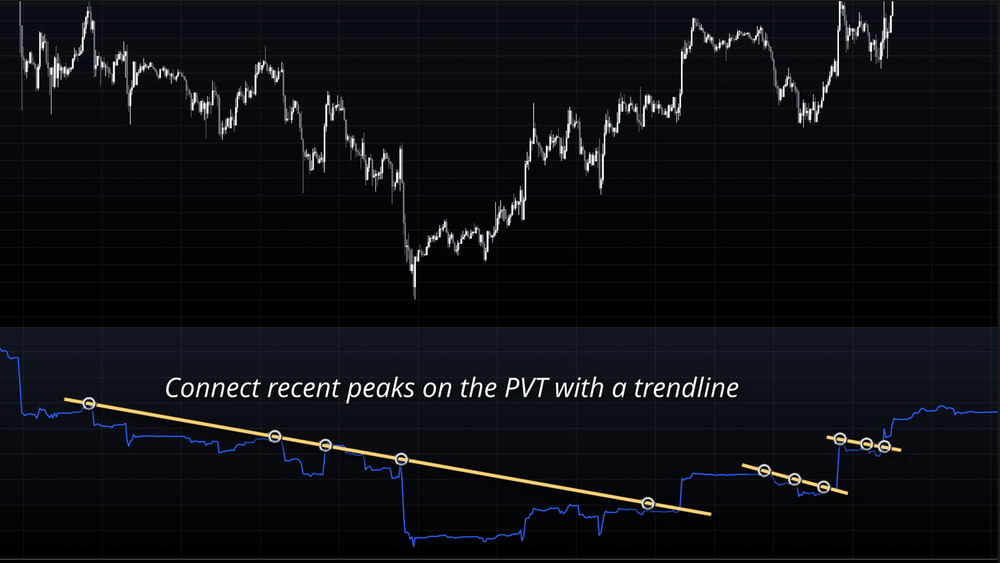
Once a price has broken out of a range and established a trend, PVT becomes an even more powerful ally. Missed the initial breakout? No problem. You can still identify entry opportunities by:
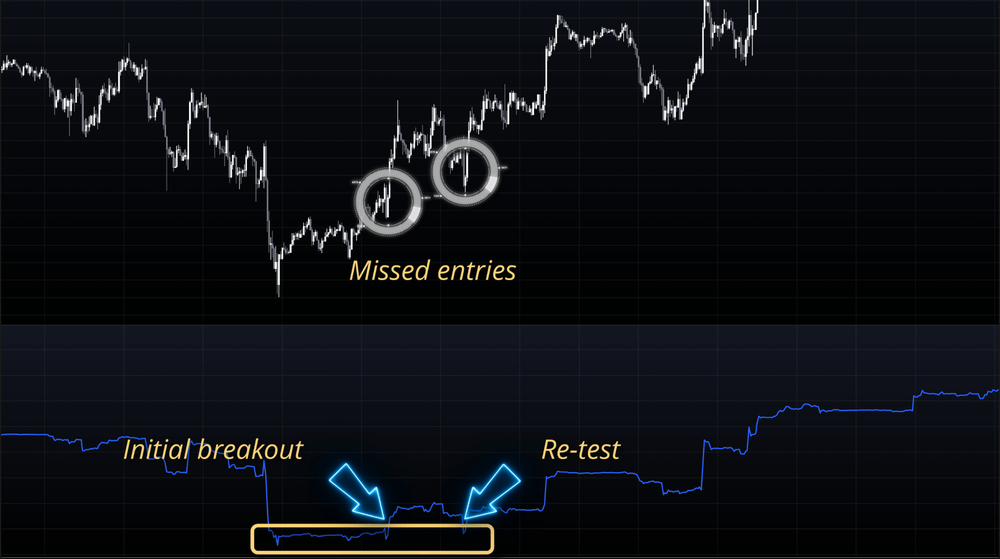
- Marking the PVT’s last high and waiting for a break
- Drawing trendlines connecting PVT peaks for potentially earlier entries
Refining Your Strategy: Entry Filtering
To avoid late or ineffective entries, consider implementing an additional filter. Use a trendline on the price chart and only take trades where the price is close to this line. This approach helps eliminate entries where significant price movement has already occurred.
Pro Tip
While drawing trendlines can provide earlier entries, remember that this method requires more subjective interpretation. Practice and careful observation are key.
Conclusion
The Price Volume Trend indicator offers traders a sophisticated yet straightforward tool for analyzing market dynamics. By combining volume insights with price movement, it provides a more nuanced approach to technical analysis.
Whether you’re looking to identify trend reversals or confirm existing momentum, PVT could be the indicator you’ve been searching for.
Interested in diving deeper? Drop a comment below with your favorite volume-based strategies or indicators you’d like to see combined with PVT.


